Capture Customer Requirements
09 Mar 2022Hi guys, today I want to share and summarize what I have learned about the method for capturing customer requirements effectively.
I was bad in collecting customer requirements because there was no method in my mind, everything had done was come from unexpectedly thrown out thoughts and there were no in-order steps for doing that.
I realized that weakness and start learning, discovering good articles mentioned about in-order steps (or called as standard method :D) for collecting customer requirements, I will summarize them in this blog post and hope that it could be my standard every time working on gathering customer requirements.
Okay, let’s start!
Collect customer requirements
It is the story about processing 4 steps below in order:
- Identify
- Capture / Collect
- Analyse
- Translate
Identify
who are the customer? (internal or external, one or several with different needs)
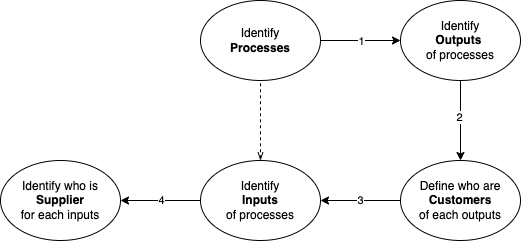
there is a tool for indentifying requirements called SIPOC
SIPOC
acronym of Suppliers, Inputs, Process, Outputs, Customers
constructed using 5 steps below in order:

Capture / Collect (Customer needs)
2 ways of collecting customer needs:
service level agreement (SLA)orspecification(straighforward way)- conducting a full range of
surveys of different customersand there varying requirements (more complex way)
2 kinds of data for customer needs:
Lagging data: past customer’s behaviour (already exists, high cost learned from operation) - Existing customer surveys - Warranty information - Industry publications and articles - Research reports - Market forecasts - Strategic planning documents - Specifications and SLALeading data: future customer behaviour or needs (not exists, high cost to collect) - Interviews (by phone or face to face, to learn about particular customer segment) - Focus Groups (small group of customer to uncover general needs) - Surveys (large sample to provide quantitative customer needs and opinions) - Market Research (market need, market size and competition)
Analyse
quantitative and qualitative data
examine the collected requirements. In other words, think how they can be made relevant to the project (ie. summaries survey results), after then confirming whether customer and their needs should be segmented or divided into different groups.
it will impact on different phases of project.
you might think that how to analyse those collected data? Is there any method to transform a bunch of words (from specification, interviews…) into well-defined checklist for project? Yeah…luckily there is:
- for
quantitative data(from questionaires): can be transformed into statistic chart by deviation, standard, mean, min/max… - for
qualitative data(from interviews, statements of customer specifications): hard to defined and understand -> using Affinity Diagram (organize and group customer needs)
so what is Affinity Diagram?
Affinity Diagram is a visual tool that helps organize the information, ideas into different groups or categories based on their relationships.
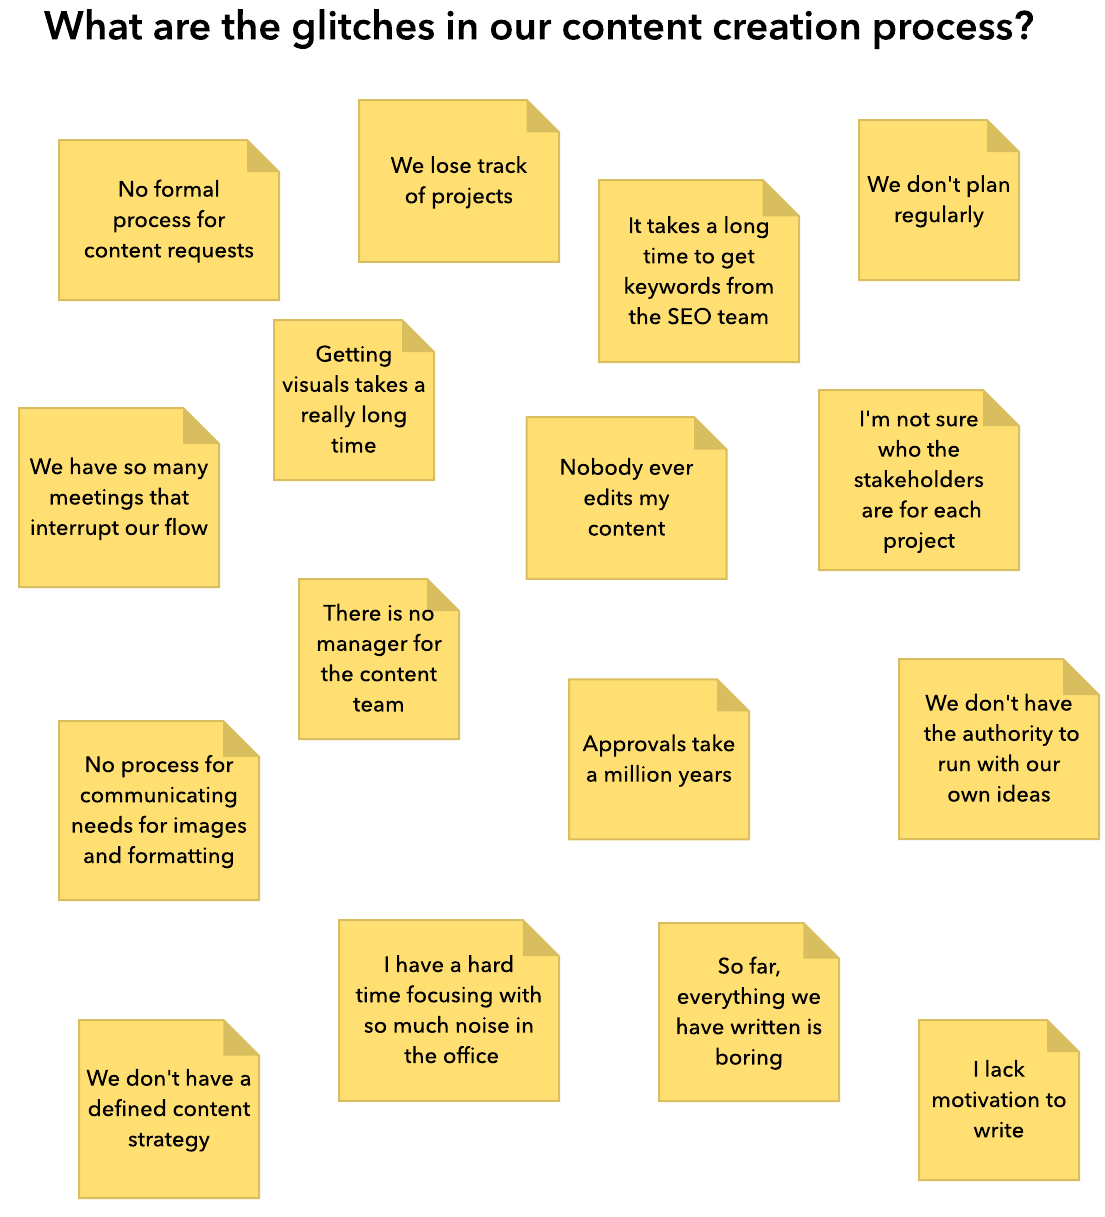
- ideas and information during the brainstorming session
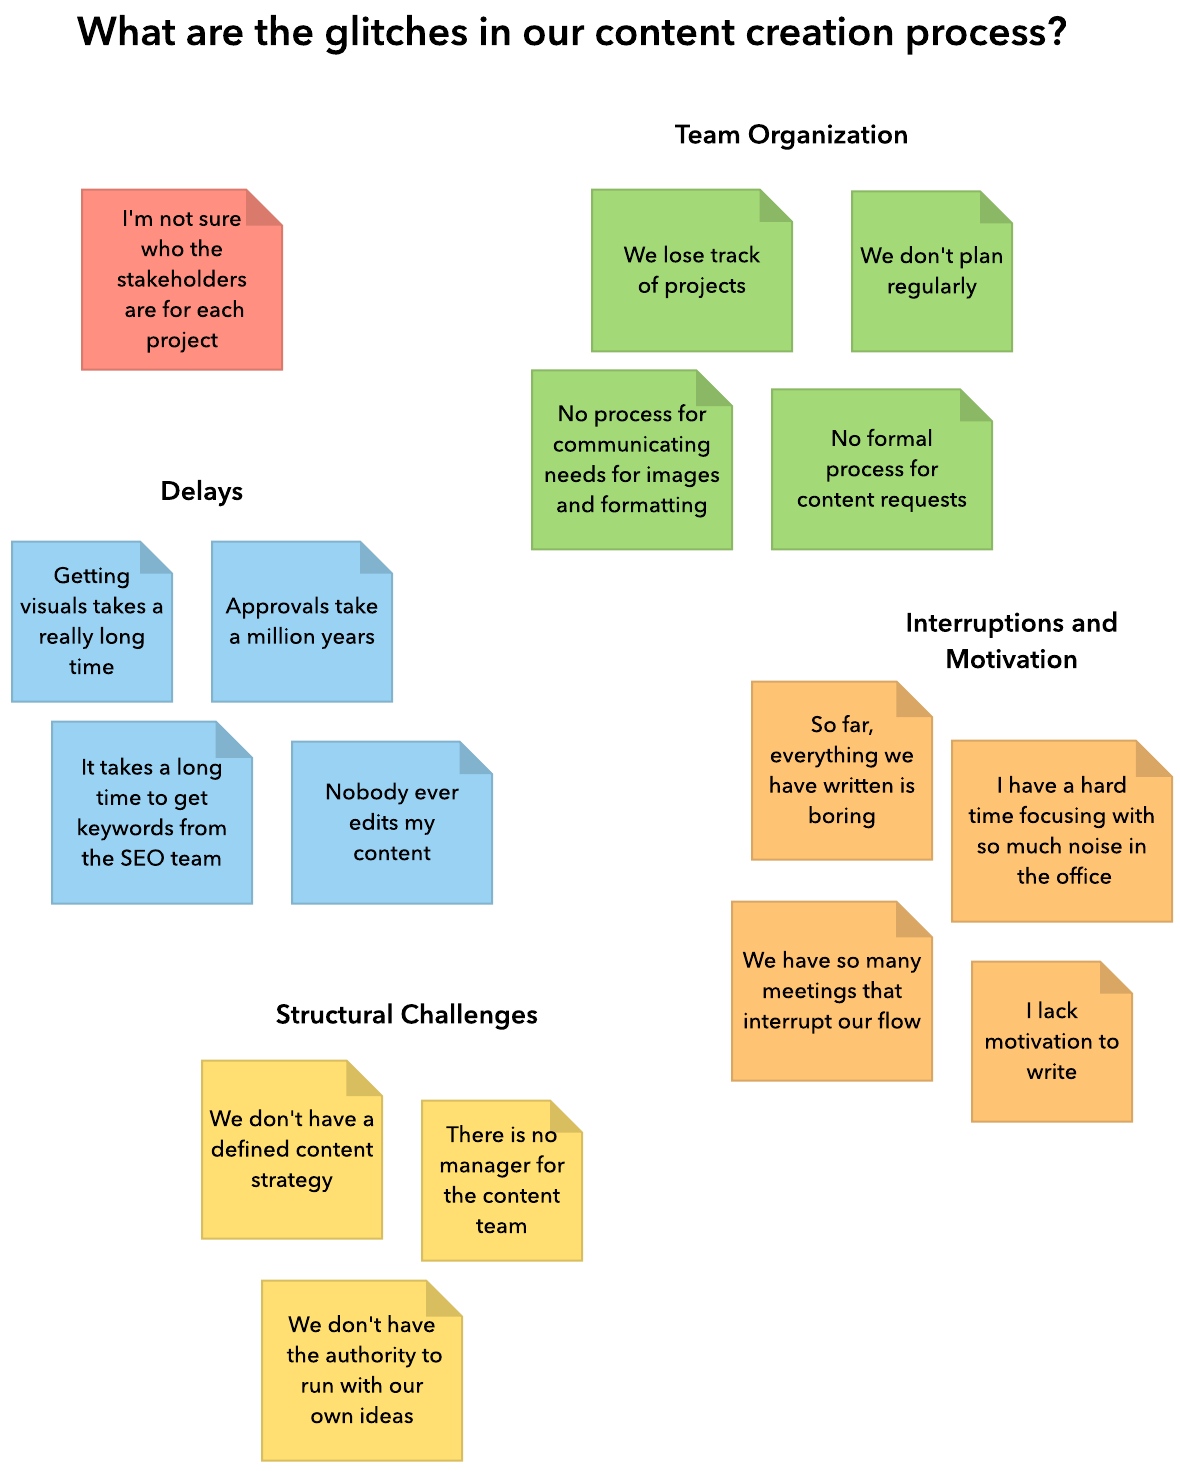
- after applying affinity diagram
how to process qualitative data by using Affinity Diagram (software tool for affinity diagram?)
- collect all customer needs, wants and opinions and have each recorded on the adheresive note on a large surface (whiteboard)
- team working to group needs into logical groups (product, delivery, market, user types,…)
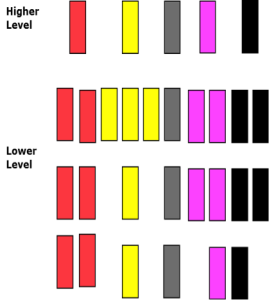
- for each logical group: arrange
high lelel customer need on the top,low level needs underneath, so the more specific statement are at the bottom. (ie. “excelent delivery service” would be at the top and “delivery on time within 2 days” would be at underneath)
- Loop through “sub-team creates – whole team edits” process until you have the full team consensus that requirement groups are roughly equal in importance and levels are all well-defined.
once the data has been analysed, it can be added into SIPOC chart, to extend it to have full and clear statements/information.
Translate
take our analysed requirements into meaningful data for the project, in the form of specifications and tolerances.
there are 2 methods:
- CTS (critical to success) tree
- Kano analysis
let’s dive in CTS tree
- it’s a tool that can break subjective statements into the meaningful things which have
particular pointandmeasureable attributes(just likeOKRs) - to give an illutration of what I mean, let’s look at the case of “I want a great service”
- 3 steps in creating CTS tree:
- try to translate
customer requirement“I want a great service” intobusiness termas “it is critical we deliver when we promised” - once CTS has defined, identify the
process characteristicsthat influences it. For instance, “deliver on time” is theprocess characteristicthat influences “delivery when promised”. - then define suitable measurement for
process characteristicswith a nominal value and tolerance. In this example, “deliver on time” can be defined as the time customer receives the order fulfilment, with a nominal value of 3 days and a tolerance range of -1/2 -> 0 days (nothing later than promised).

- try to translate


